
Despite teaching's centrality to the academic experience, many faculty members do not make it a central focus of their research. Working with SOLER is an excellent way for teaching faculty to attach evidence of efficacy and improvement to their work, demonstrating effective and skillful teaching. Making the classroom a site of learning on both sides of the podium by bridging both student engagement and learning analytics, we can adapt with new strategies to changes in students over time.
Building on these topics, one of SOLER’s objectives is to utilize learning analytics to identify strategies to increase student engagement and see which students may need additional support. One way we do this is by processing learning analytics data from Canvas access data, Panopto view records, and even Vocareum activity, to observe patterns to test hypotheses with a controlled experiment.
As one of the main informative features of this webpage, SOLER has conducted substantive work on how nudges affect student engagement in public health courses. This work, encapsulated by three papers, is depicted below.
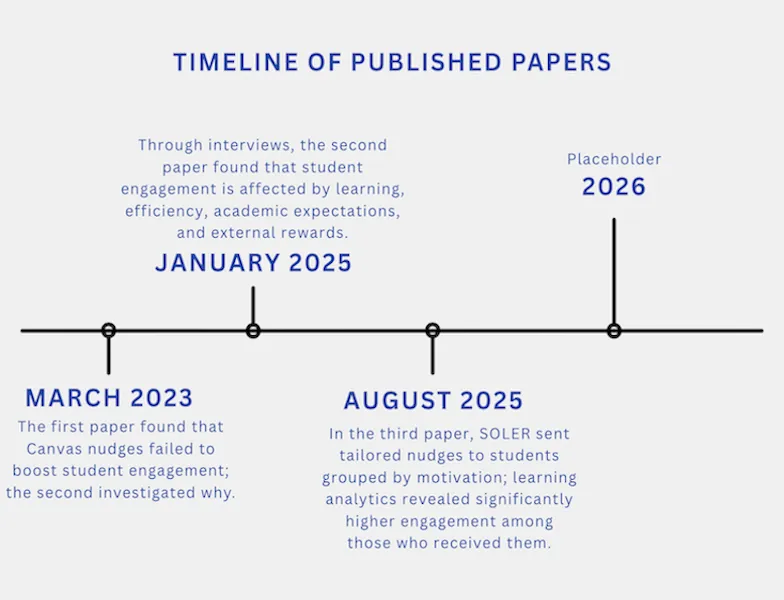
Read the complete paper abstracts and access the papers.
We also introduce follow-along tutorials to view Course Analytics for your own class(es), as well as an interactive demonstration interface to see which Canvas pages your students frequently visit and interact with. All instructions are provided below; these demonstrations are meant to be accessible and do not require prior coding knowledge.
Student Engagement and Learning Analytics
Student engagement is key to learning, which comes in many forms such as raising a hand and asking a question in class, skimming through an assigned reading, or reviewing old lecture slides (Johar et al., 2023). By actively interacting with instructors or instructor-provided materials, students improve their intellectual skills, practical competence, moral development, self-image, and grades (Quaye et al. 2019).
As a mediator between your course content and the students' learning, student engagement motivates instructors to be intentional about how they design their course content, course learning management system (CourseWorks powered by Canvas, Blackboard, Google Classroom, etc.), and learning activities to monitor and maximize engagement (Reeve, 2012) (Johar et al., 2023).
But where do instructors start in increasing student engagement in their classes?
How can instructors know what is working and what is not?
How can instructors find out which students need more of a push to engage?
Learning analytics addresses all of these questions! It is the collection, analysis, interpretation and communication of data about learners and their learning that provides theoretically relevant and actionable insights to enhance learning and teaching (Society for Learning Analytics Research What is Learning Analytics - Society ...)
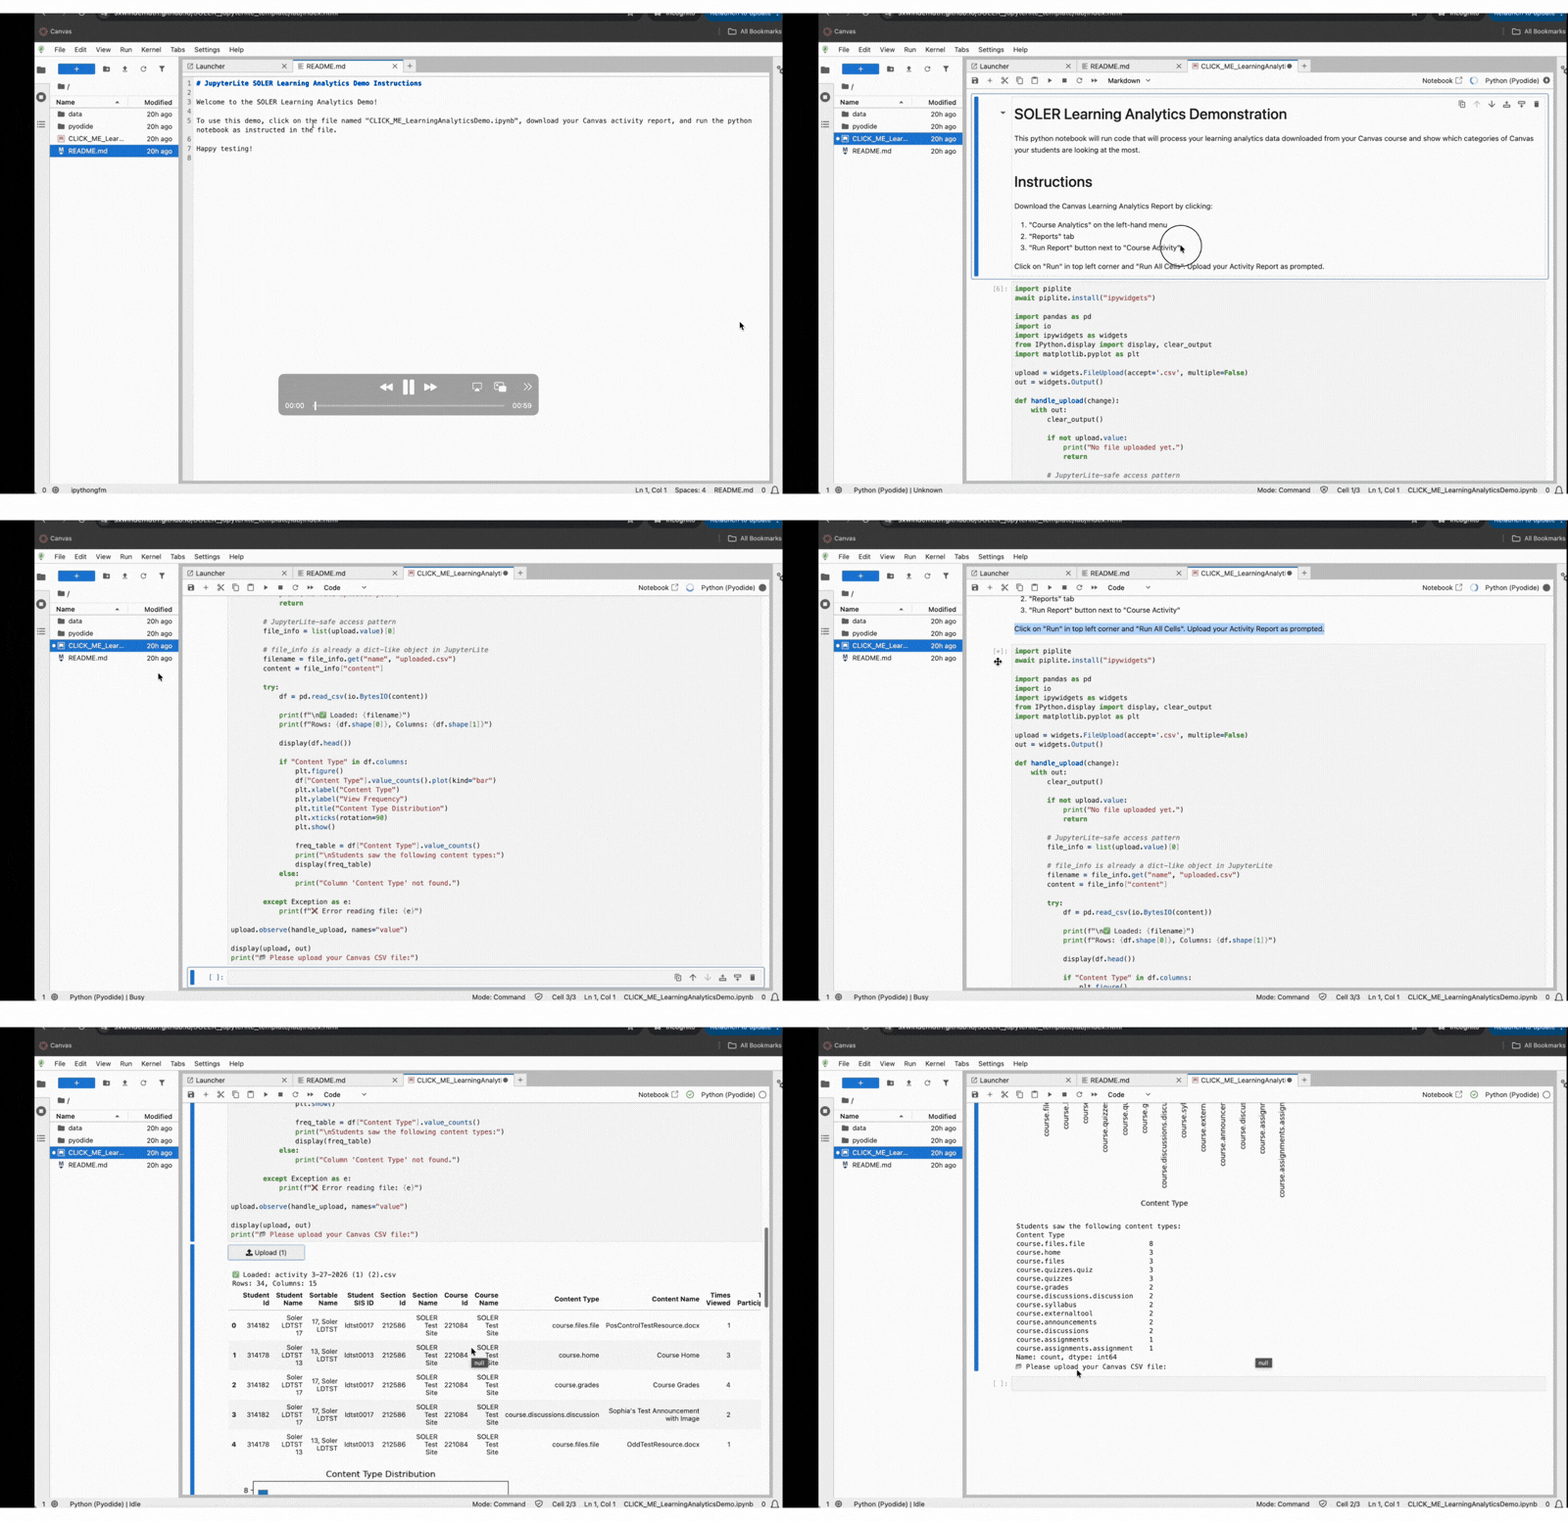
Did you know that your students’ interactions with your Canvas materials is right at your fingertips? Follow the GIF tutorial below to learn more about this Canvas feature.
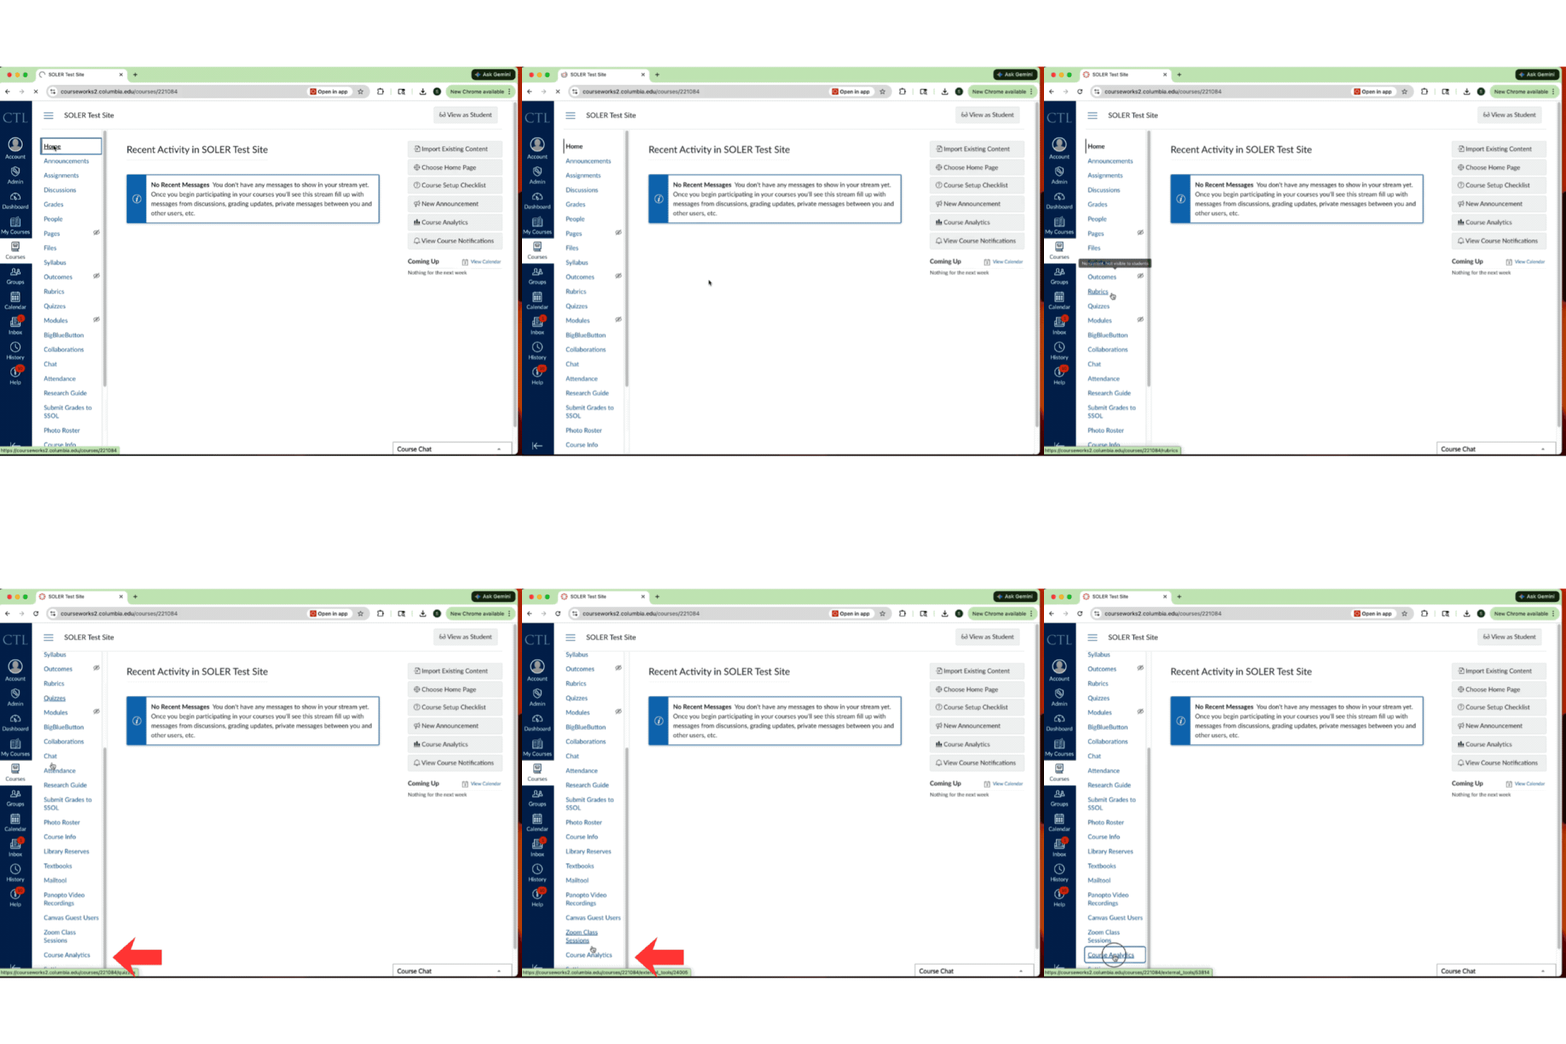
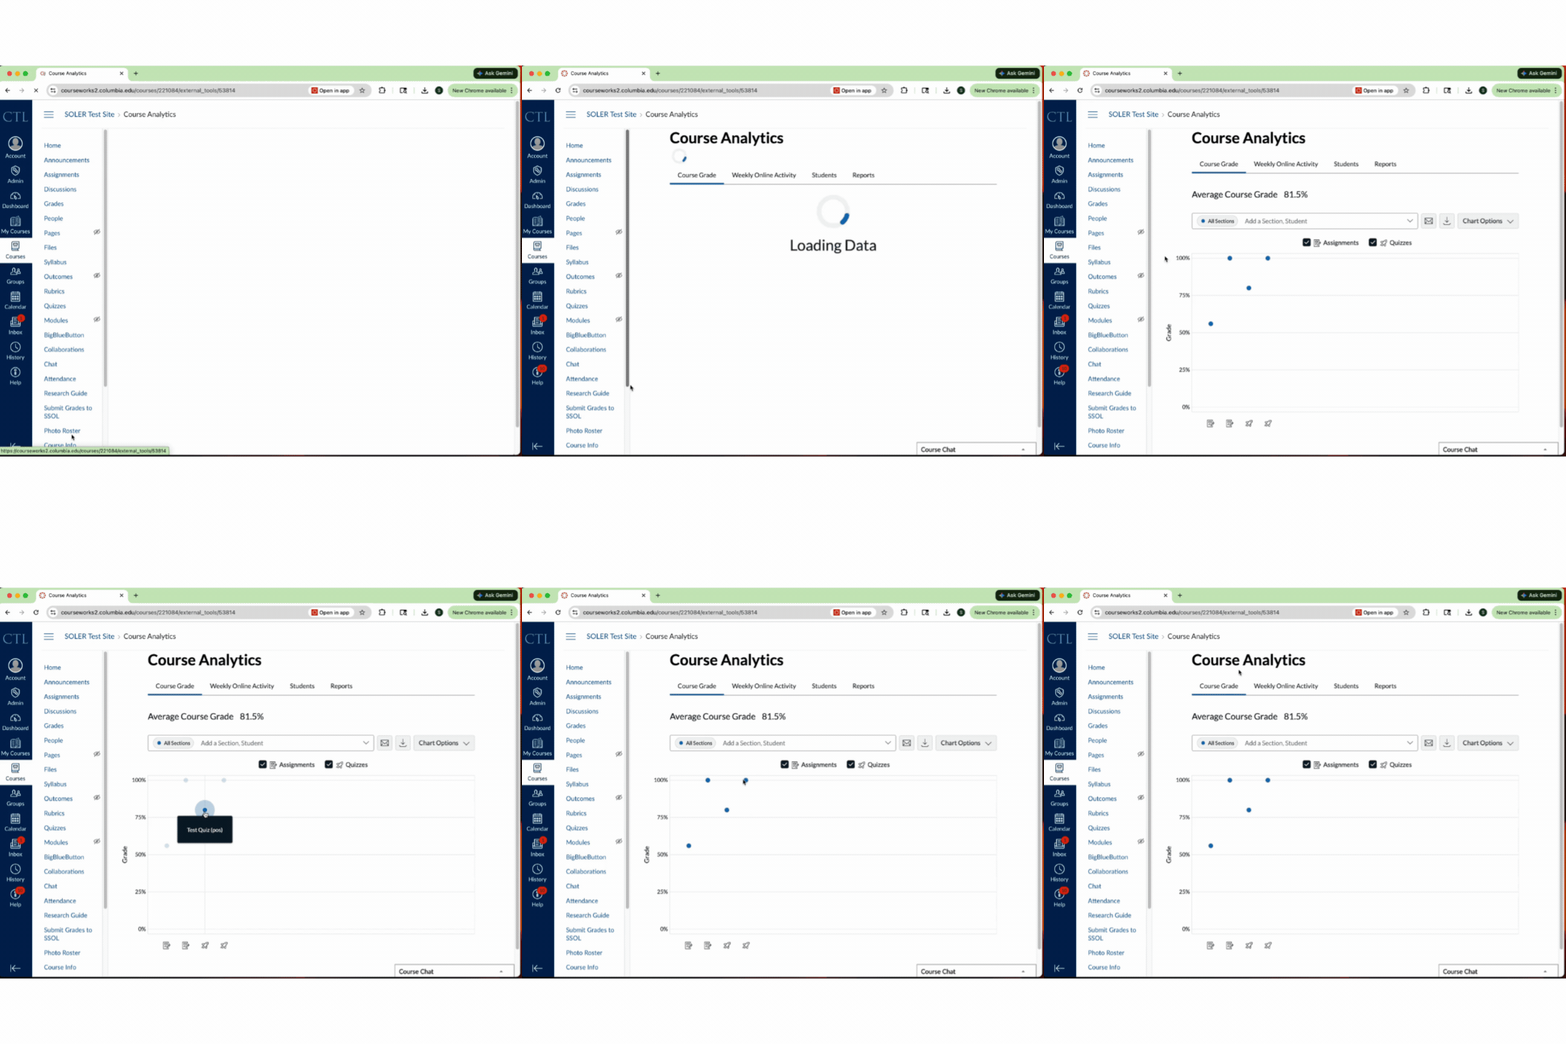
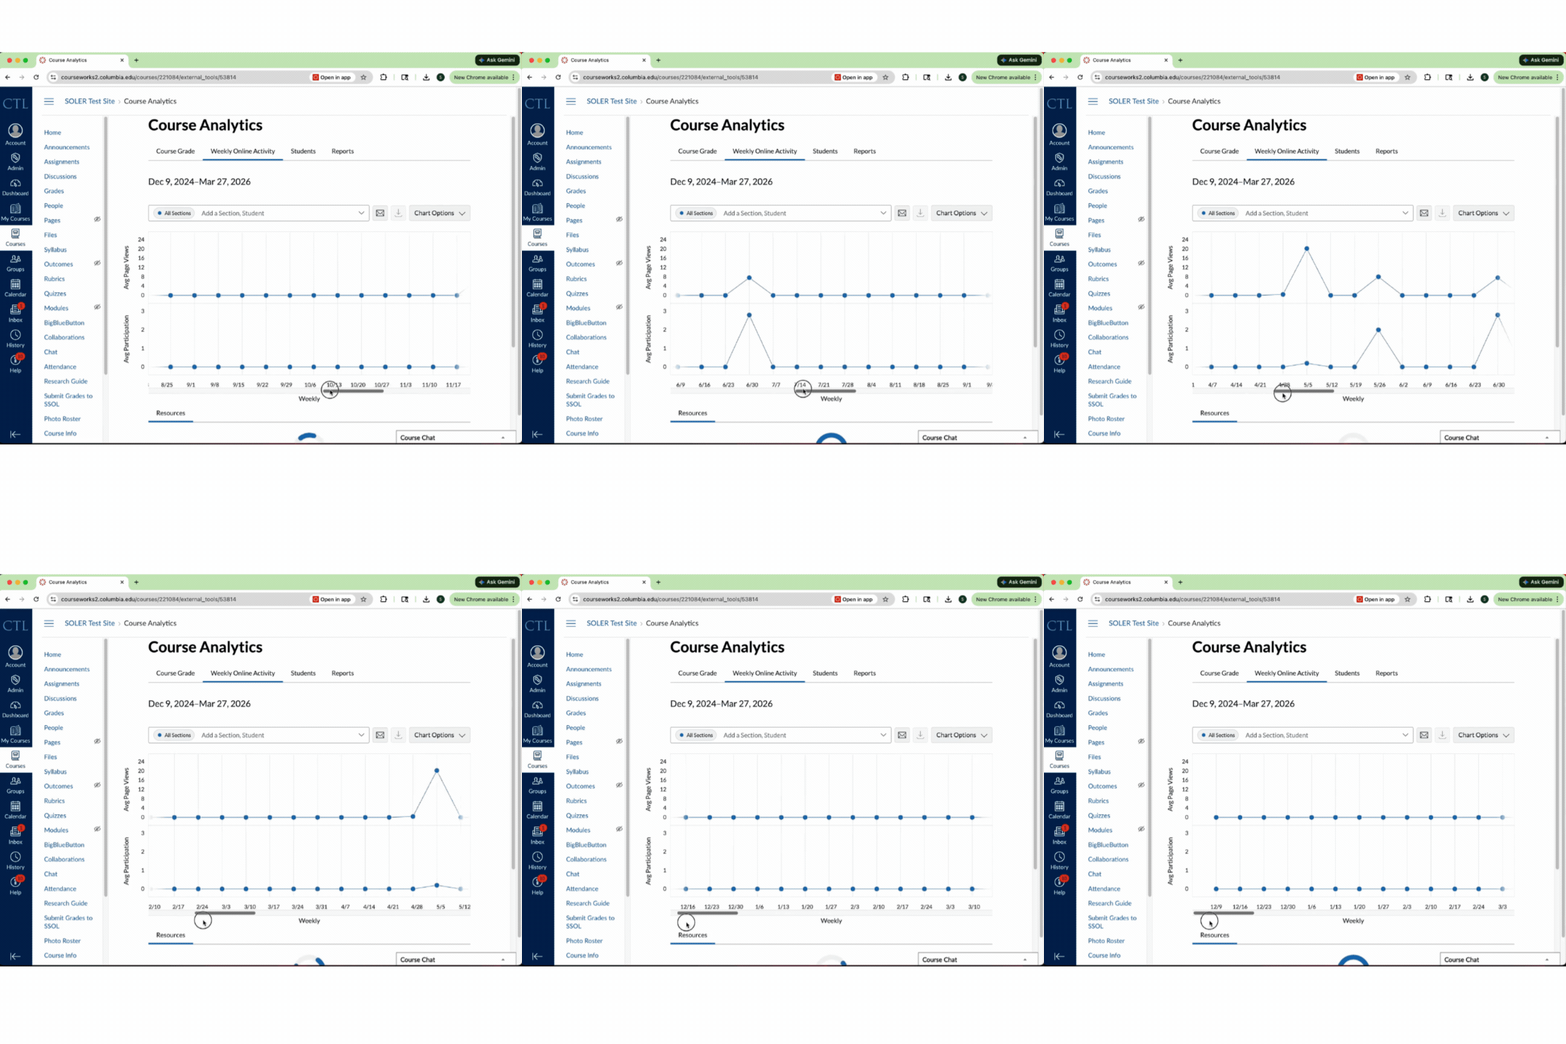
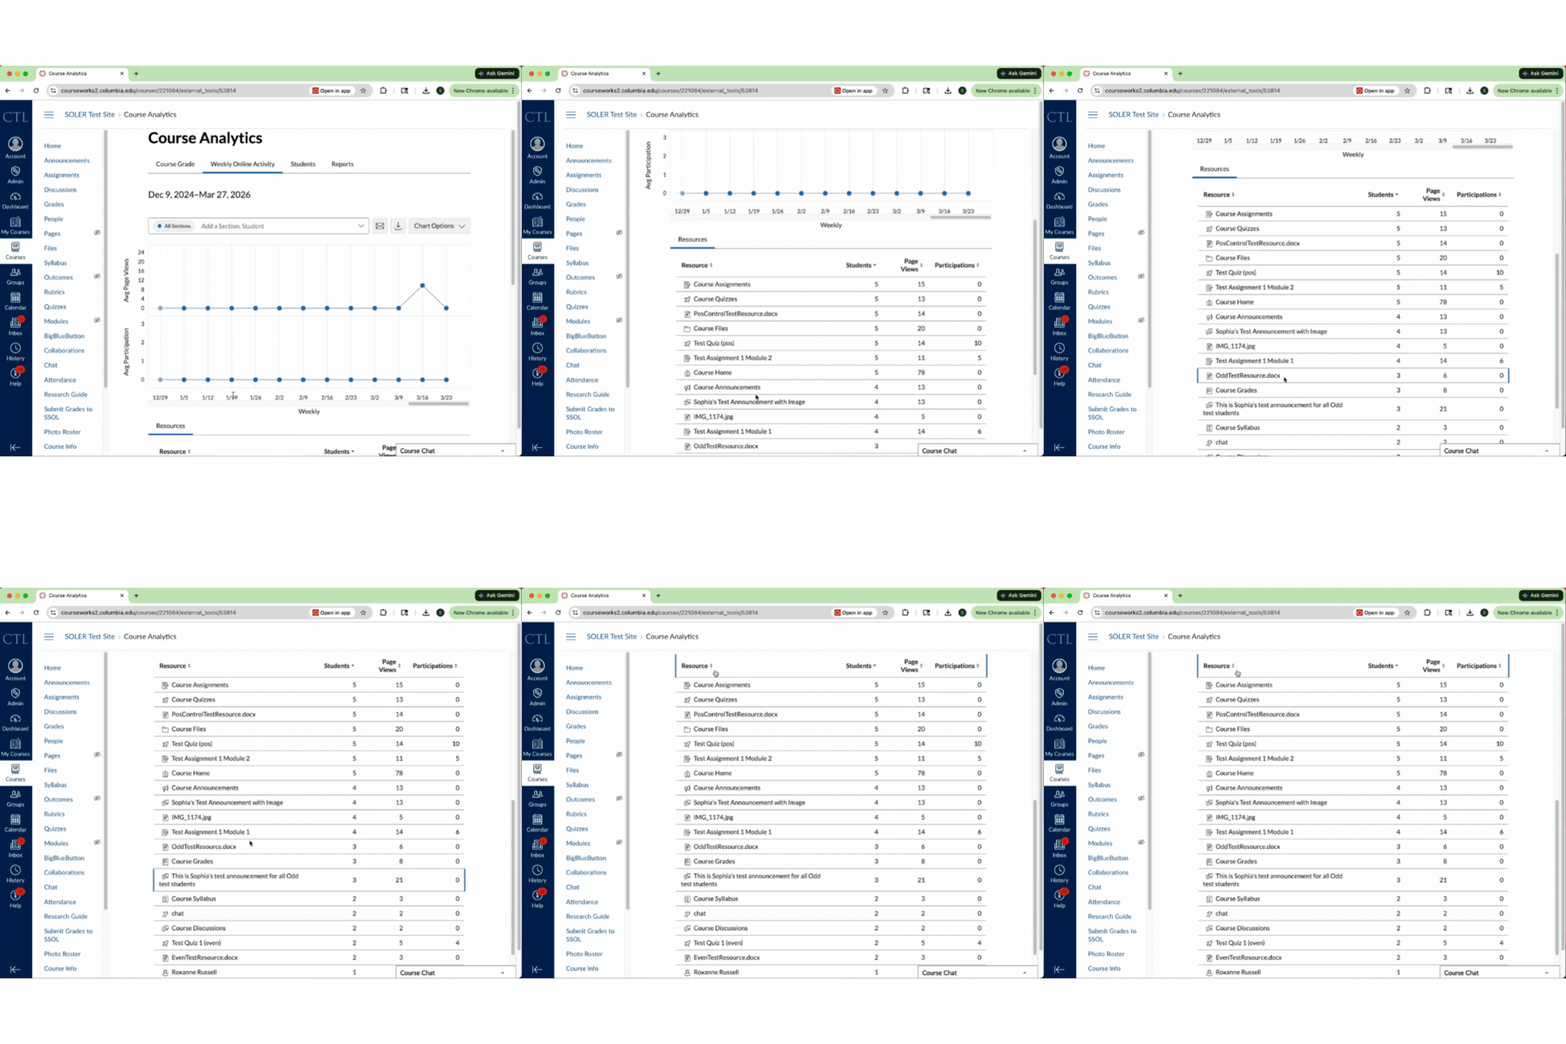
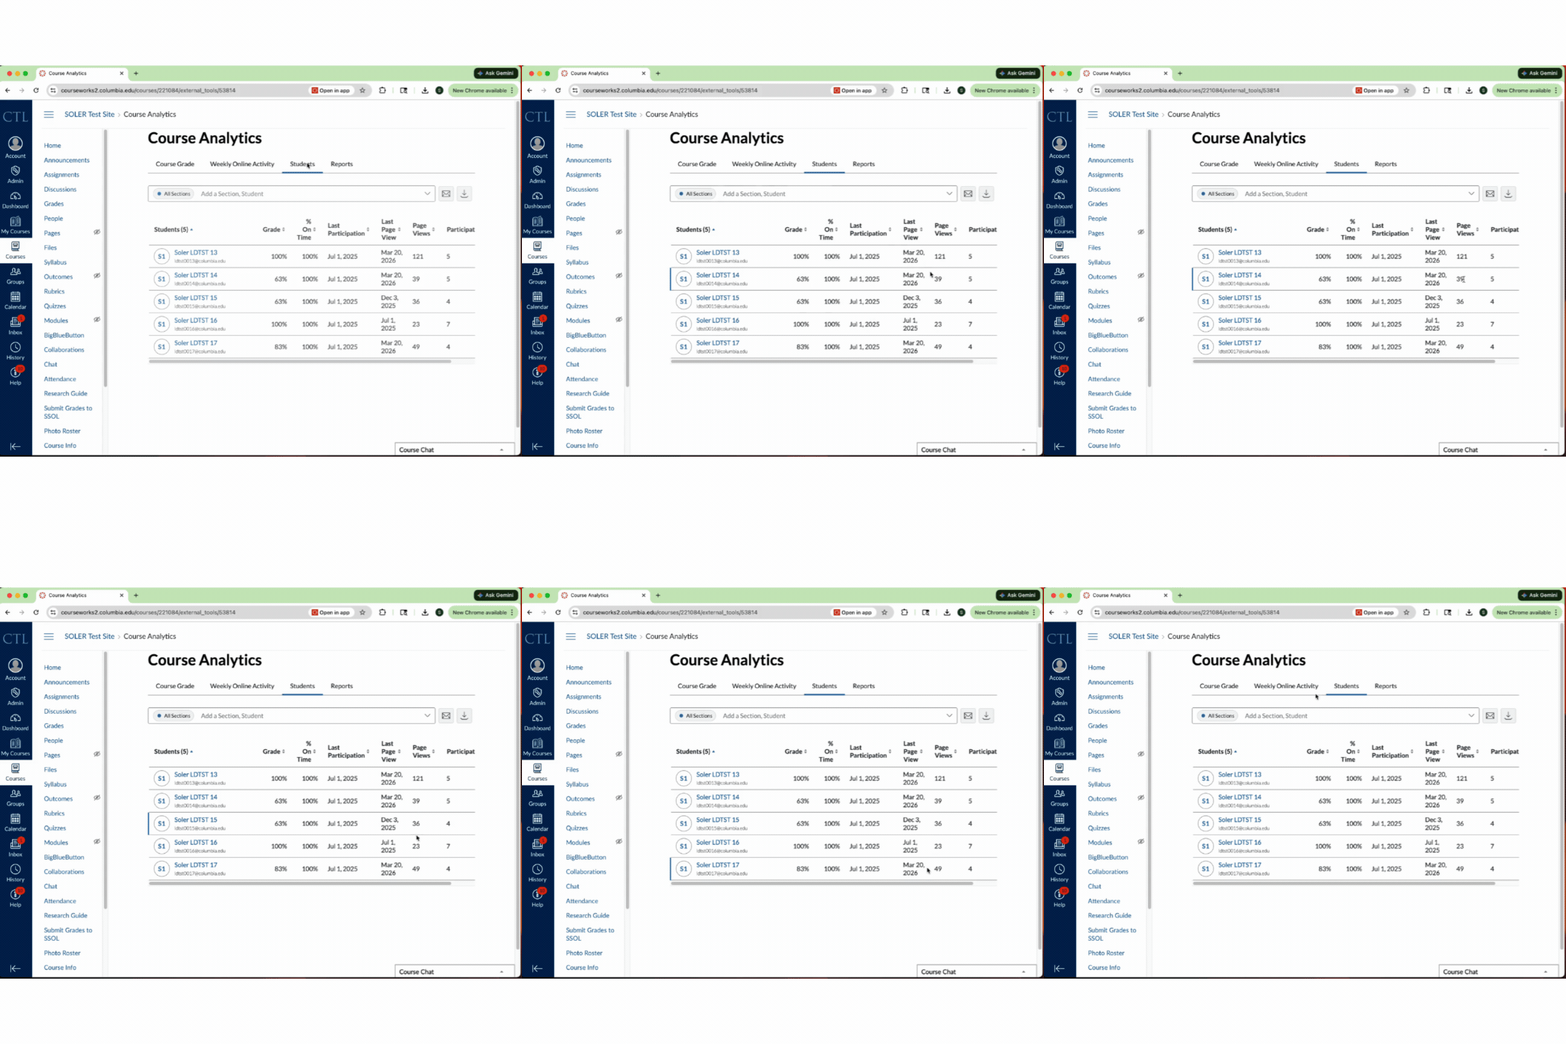
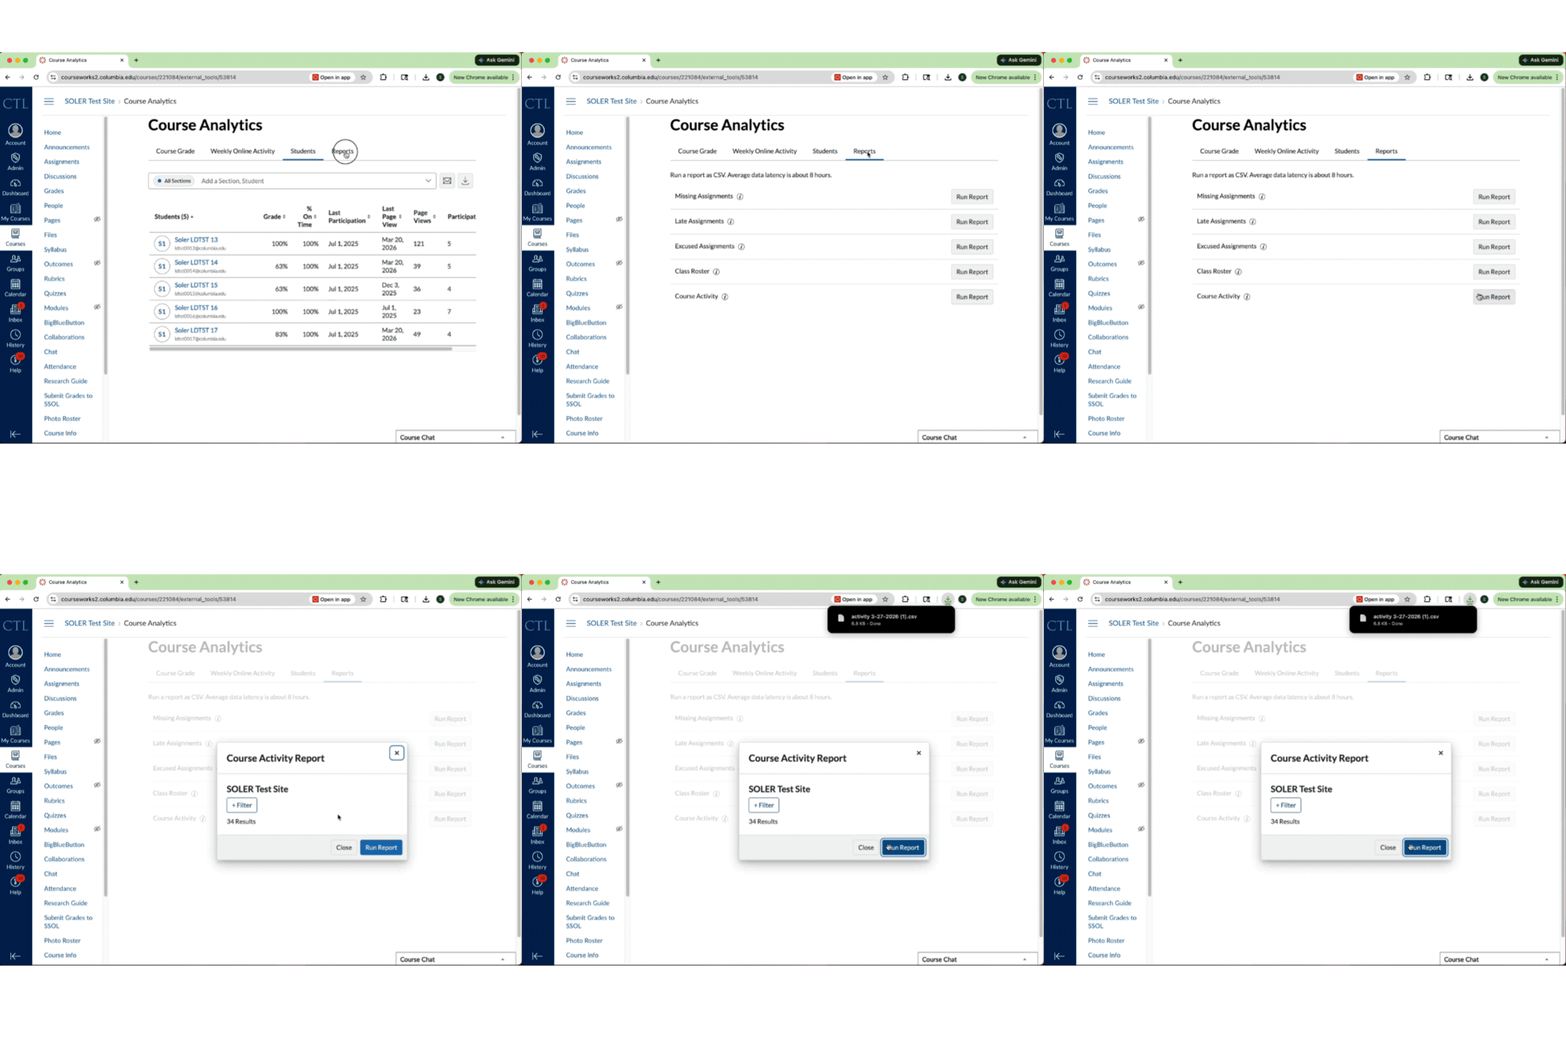
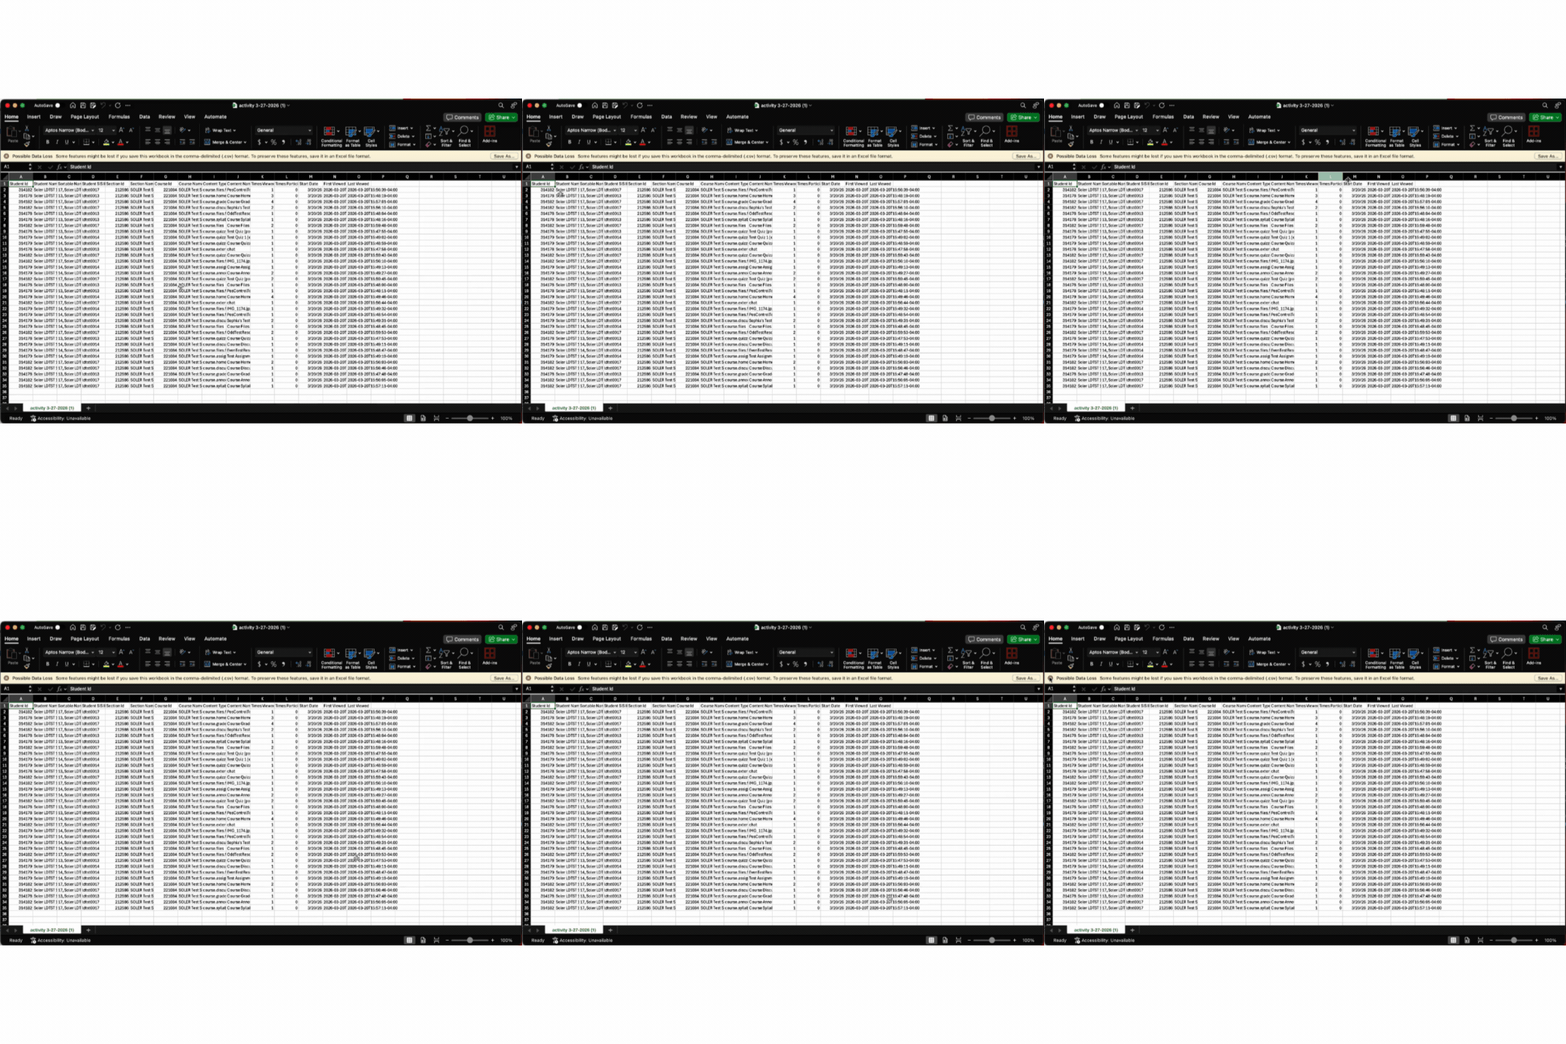
Instructions for Viewing Canvas Learning Analytics
Interactive Demonstration
Try out this interactive demonstration to identify what Canvas pages your students are looking at the most frequently.
Visit this interactive demonstration interface, then upload your course activity file (see "Instructions for Viewing Canvas Learning Analytics" Figures 6-7) and run the code. A GIF visualization of these steps is provided below.
If you would like to try out the demonstration without uploading your own course activity file, download this sample file and then upload it when prompted by the interface.
SOLER and Public Health Research
Combining both student engagement and learning analytics, SOLER has published three papers detailing how nudges affect student behavior in public health classrooms. We invite you to explore the papers below.
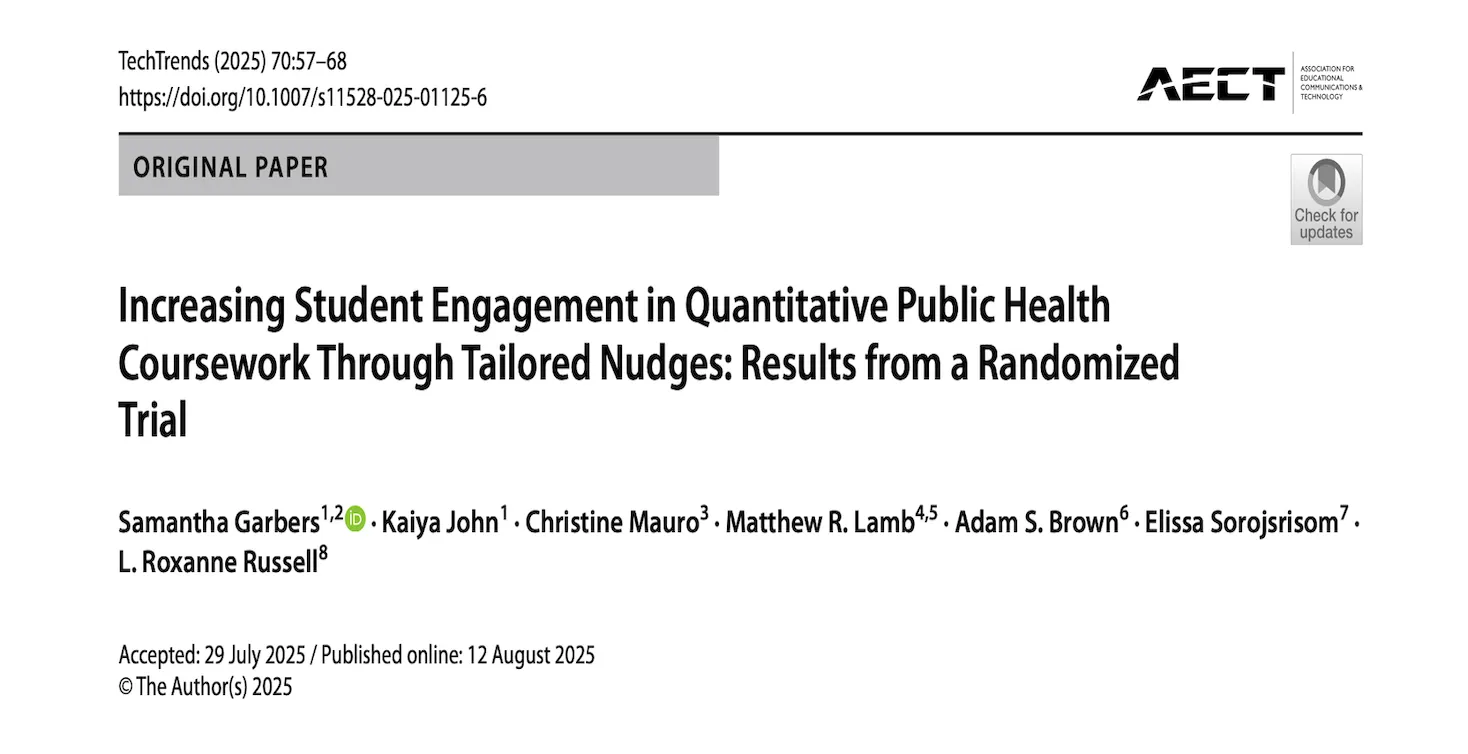
August 2025: Student engagement predicts favorable educational outcomes. Nudges are increasingly applied to higher education contexts to promote engagement. A randomized study in a large quantitative analysis public health course deployed nudges catered to students’ intrinsic motivations. Participants (n = 127) self-selected into motivation groups (Learners [n = 46], Doers [n = 48], or Performers [n = 33]); half were randomized to receive four nudges tailored to their motivation group. Read the full paper here.
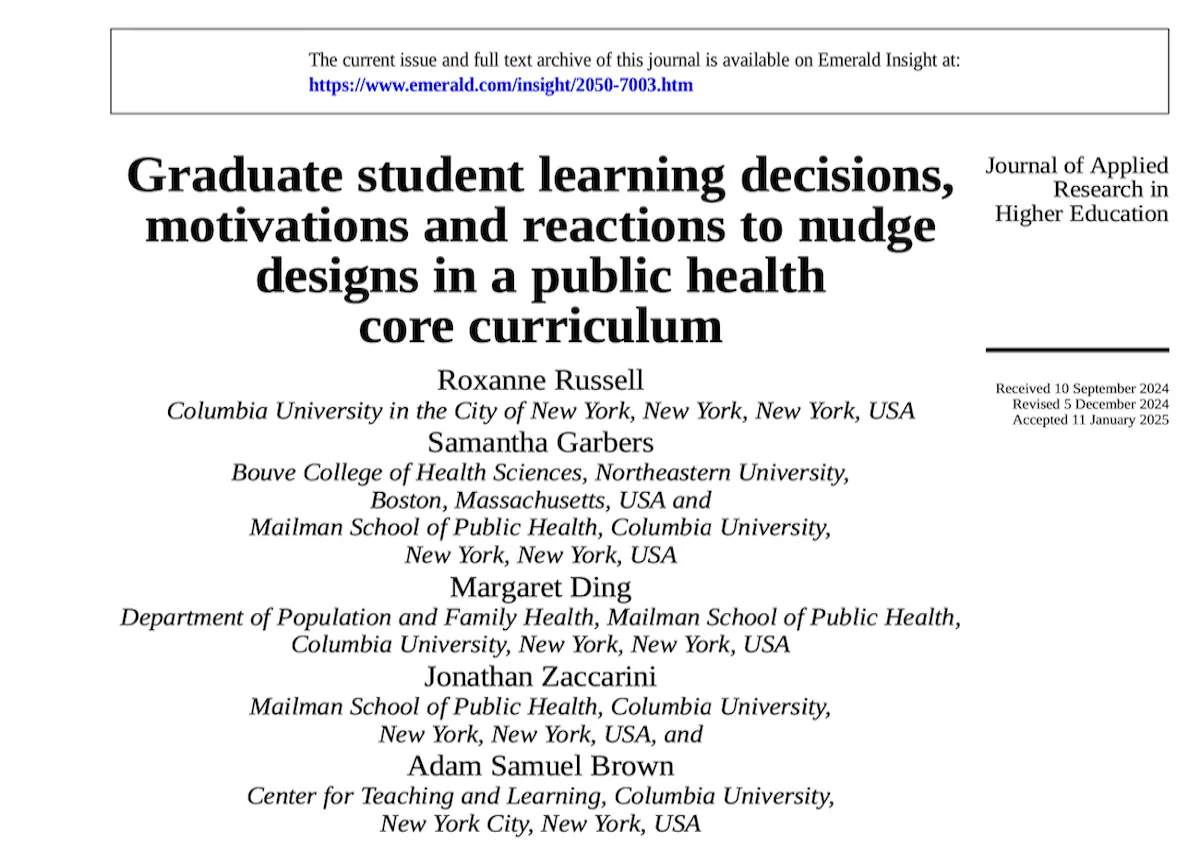
January 2025: Learning analytics are often used as proxies for student engagement. More qualitative data on how post-secondary students engage with course elements are needed to guide the design, development and deployment of learning analytics information, particularly in the use of nudge techniques. In the context of a graduate-level quantitative course within a public health core curriculum, the following research questions were explored: What do students cite as their motivations when making decisions about whether, when or how to engage with course content and learning supports? and What are student reactions to visual prompts designed to activate these motivations? Read the full paper here.
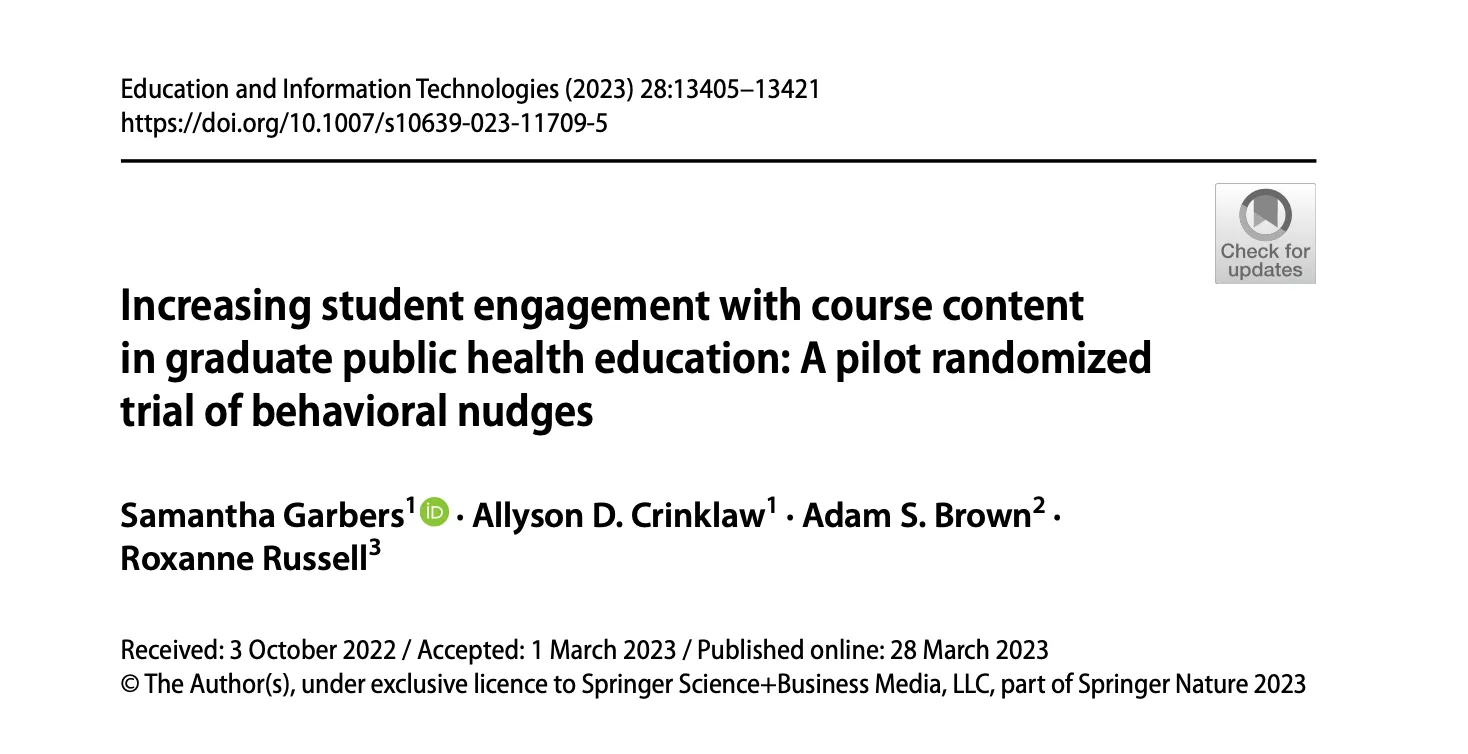
March 2023: Digital advances in the learning space have changed the contours of student engagement as well as how it is measured. Learning management systems and other learning technologies now provide information about student behaviors with course materials in the form of learning analytics. In the context of a large, integrated and interdisciplinary Core curriculum course in a graduate school of public health, this study undertook a pilot randomized controlled trial testing the effect of providing a “behavioral nudge” in the form of digital images containing specific information derived from learning analytics about past student behaviors and performance. Read the full paper here.